
Analize your extensions through custom telemetry (English Version)
Analiza tus extensiones a través de la telemetría personalizada
La telemetría personalizada es una herramienta poderosa para obtener información sobre el comportamiento y el rendimiento de nuestras extensiones. Nos proporciona información valiosa sobre el rendimiento de las extensiones, las interacciones del usuario y cualquier problema encontrado a través de la creación de nuestras propias señales de telemetría. Estas señales son enviadas al servicio Application Insights, que forma parte de la plataforma Azure. Monitoring and Analyzing Telemetry
Es posible que deseemos realizar un seguimiento de información adicional específica de la extensión. Debemos seleccionar señales sobre las cuales se pueda actuar y que la siguiente pregunta tenga una respuesta: ¿qué puede hacer el cliente o el partner con estas señales de telemetría?
Configuración
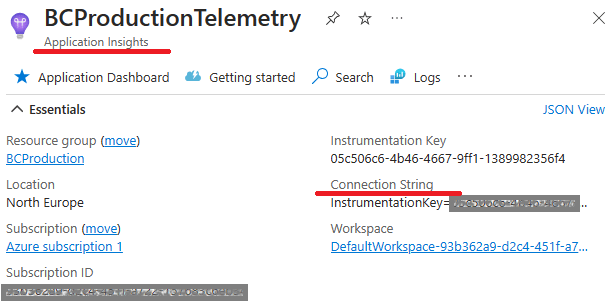
La primera configuración está relacionada a la del servicio Application Insights en Azure. Application Insights overview.
El siguiente paso será agregar la configuración «applicationInsightsConnectionString» al archivo app.json de la extensión como se muestra: Sending App/Extension Telemetry to Azure Application Insights. No es una propiedad obligatoria de usar, solo si deseas usar la telemetría en la extensión específica.
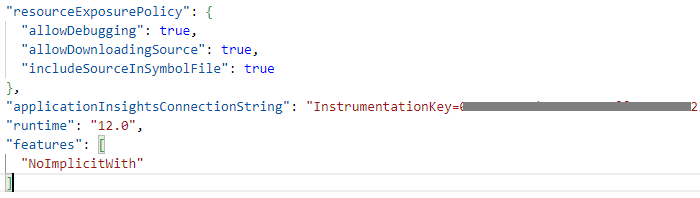
Obtenemos el valor de la cadena de conexión del servicio de Application Insights del partner, los datos de las señales de telemetría personalizadas de la extensión se recopilerán en este servicio.
Session.LogMessage
Para crear una señal de seguimiento de telemetría personalizada, usaremos el método SESSION.LOGMESSAGE.
Se debe usar este método en el objeto que emita la señal de la telemetría a seguir y analizar.
Session.LogMessage(EventId: Text, Message: Text, Verbosity: Verbosity, DataClassification: DataClassification, TelemetryScope: TelemetryScope, CustomDimensions: Dictionary of [Text, Text])Los parámetros de este método son los siguientes:
- EventID: Es el ID del evento que desea enviar. Se debe intentar que sean únicas
- Message: Es el contenido del mensaje para el evento que deseamos enviar.
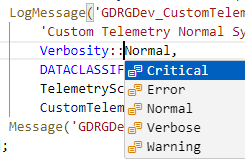
- Verbosity: Enumeración que especifica el nivel de gravedad de la señal de seguimiento de telemetría. El valor puede ser Crítico, Error, Advertencia, Normal o Detallado.
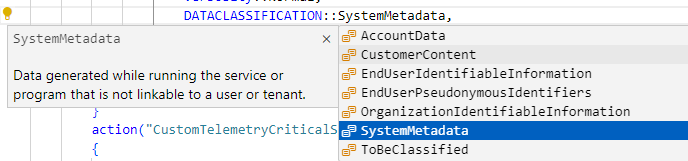
- DataClassification: La telemetría debe respetar la privacidad. Los eventos con una clasificación de datos distinta de SystemMetadata no se envían a los recursos de Application Insight. Es importante revisar las llamadas de LogMessage para evitar que se envíen datos sensibles del cliente a los recursos de Azure.
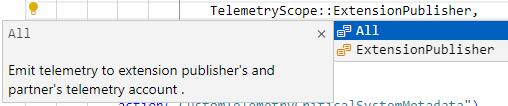
- TelemetryScope
- ExtensionPublisher: Envía la señal de telemetría personalizada al servicio de Application Insights del partner configurado en el archivo App.JSON de la extensión. Será la que principalmente utilizaremos en nuestras extensiones.
- All: Envía la señal como la opción anterior, pero adicionalmente lo envía al servicio de Application Insights configurado en el Centro de Administración de Business Central en el ambiente del Tenant. Environment Telemetry in the Business Central administration center. Si el cliente no podrá hacer nada por su cuenta con esta señal, no debemos enviarle ninguna señal y evitarle este consumo en sus recursos.
- CustomDimensions: Define las dimensiones personalizadas para la señal de seguimiento, pueden ser:
- Dictionary
Session.LogMessage(EventId: Text, Message: Text, Verbosity: Verbosity, DataClassification: DataClassification, TelemetryScope: TelemetryScope, CustomDimensions: Dictionary of [Text, Text]) - Dimension overloads
Session.LogMessage(EventId: Text, Message: Text, Verbosity: Verbosity, DataClassification: DataClassification, TelemetryScope: TelemetryScope, Dimension1: Text, Value1: Text [, Dimension2: Text] [, Value2: Text])
- Dictionary
Consideraciones
Se incluyen automáticamente varias dimensiones personalizadas en las llamadas de seguimiento que se envían a Application Insights. Por ejemplo datos genéricos de la extensión y del objeto que llama al método Session.LogMessage:
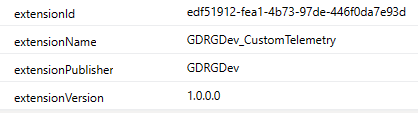
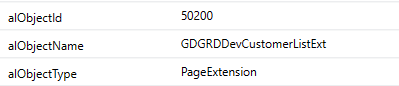
También tenemos la información del tenant, de la extensión y versión que emite la señal, del ambiente y tipo de ambiente, así como el nombre de la empresa. Aquí la información de todas dimensiones por defecto. Default CustomDimensions
Estas señales de telemetría personalizada la podemos utilizar adicionalmente para:
- Identificar que funcionalidades están o no están en uso en nuestra aplicación
- Acompañar en el proceso de onboarding de los clientes
- Analizar procesos y mejorar nuestra aplicación
Recordemos que podemos apoyarnos en otros productos para optimizar las notificaciones, configurando alertas usando por ejemplo Azure Logic Apps o Power Automate. Alert on Telemetry
Las definiciones de eventos de telemetría deben tratarse como una API por lo que deben estar documentadas, versionadas y deben evitar modificarse de manera que rompa una implementación anterior, por ejemplo un cambio de dimensiones.
Los eventos de telemetría deben documentarse correctamente orientando en la actuación ante un evento determinado.
Ejemplo
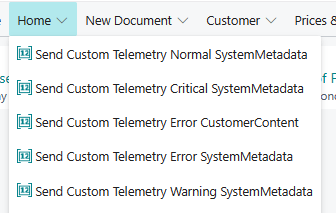
Si deseamos enviar una señal de telemetría personalizada con gravedad critica deberíamos hacer algo similar a lo siguiente (el código se ejecuta en un botón de una página extendida).
    trigger OnAction()

    var

        CustomTelemetryDimensions: Dictionary of [Text, Text];

    begin

        CustomTelemetryDimensions.Add('dimension1', 'dimension value 1');

        CustomTelemetryDimensions.Add('dimension2', 'dimension value 2');

        Session.LogMessage('GDRGDev_CustomTelemetry_01',

            'Custom Telemetry Critical SystemMetadata: Spain hour' + FORMAT(Today()) + FORMAT(Time()),

            Verbosity::Critical,

            DATACLASSIFICATION::SystemMetadata,

            TelemetryScope::ExtensionPublisher,

            CustomTelemetryDimensions);

        Message('GDRGDev_CustomTelemetry_02 Signal sent!');

    end;
En el siguiente enlace se encuentra el ejemplo: Blog/GDRGDev_Custom_Telemetry at main · gdrgdev/Blog (github.com), en el ejemplo se ha enviado diferentes señales dependiendo de la criticidad, cada uno con un EventID diferente para que luego pueda analizarse de manera adecuada.
También se realiza un ejemplo con el parámetro DataClassification diferente a SystemMetaData y como se indicó anteriormente, esta señal no es recopilada en el servicio de Application Insights por motivos de privacidad.
KQL
Una vez que tenemos información de señales de telemetría personalizada recopilada y enviada al servicio de Application Insights, podemos analizarla por diferentes herramientas. Por ejemplo Power BI o KQL como vemos a continuación.
Obtenemos un listado de los eventos con el código de EventID correspondiente.

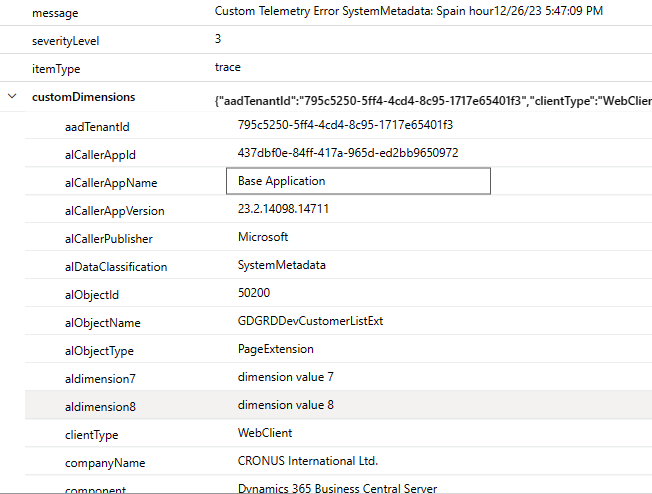
Visualizamos las dimensiones personalizadas y por defecto de cada evento de telemetría personalizado.
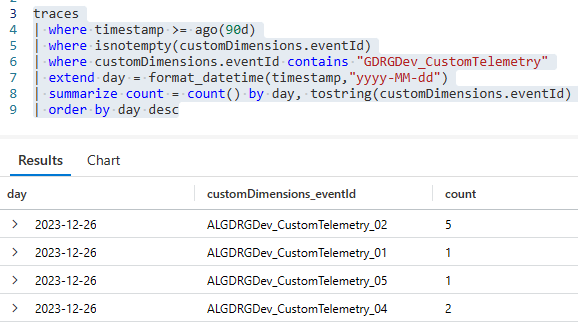
También podemos agrupar por tipo de evento y por día, lo que nos permitirá analizar la recurrencia y ejecutar los pasos de acción correspondientes por cada uno de ellos.
En resumen, la telemetría personalizada nos permite adaptar el monitoreo a las necesidades únicas de nuestras extensiones. Ya sea rastreando eventos específicos, analizando el comportamiento del usuario o midiendo métricas personalizadas, la telemetría siempre nos proporciona información esencial para mantener y mejorar nuestras extensiones.
Espero que esta información te ayude.
Analize your extensions through custom telemetry
Custom telemetry is a powerful tool to gain insight into the behavior and performance of our extensions. It provides us with valuable insights into extensions’ performance, user interactions, and any issues encountered through creating our own telemetry signals. These signals are sent to the Application Insights service, which is part of the Azure platform. Monitoring and Analyzing Telemetry
We may want to track additional information specific to the extension. We must select signals that can be acted upon and have an answer to the following question: what can the customer or partner do with these telemetry signals?
Setting
The first configuration is related to that of the Application Insights service in Azure. Application Insights overview.
The next step will be to add the «applicationInsightsConnectionString» configuration to the app.json file of the extension as shown: Sending App/Extension Telemetry to Azure Application Insights. It is not a mandatory property to use, only if you want to use telemetry on the specific extension.
We get the connection string value from the partner’s Application Insights service, the extension’s custom telemetry data will be collected in this service.
Session.LogMessage
To create a custom telemetry trace signal, we will use the method SESSION.LOGMESSAGE.
This method must be used on the object that emits the telemetry signal to be followed and analyzed.
Session.LogMessage(EventId: Text, Message: Text, Verbosity: Verbosity, DataClassification: DataClassification, TelemetryScope: TelemetryScope, CustomDimensions: Dictionary of [Text, Text])The parameters of this method are the following:
- EventID: This is the ID of the event you want to send. You should try to make them unique.
- Message: It is the content of the message for the event that we want to send.
- Verbosity: Enumeration that specifies the severity level of the telemetry trace signal. The value can be Critical, Error, Warning, Normal or Verbose.
- DataClassification: Telemetry must respect privacy. Events with a data classification other than SystemMetadata are not sent to Application Insight resources. It is important to review LogMessage calls to prevent sensitive customer data from being sent to Azure resources.
- TelemetryScope
- ExtensionPublisher: To send the custom telemetry data to the partner’s Application Insights service configured in the extension’s App.JSON file. It will be the one that we will mainly use in our extensions.
- All: Sends the custom telemetry data like the previous option, but additionally sends it to the Application Insights service configured in the Business Central Administration Center in the Tenant environment. Environment Telemetry in the Business Central administration center. If the customer will not be able to do anything on its own with this signal, we should not send it any signal and avoid this consumption of its resources.
- CustomDimensions: Defines custom dimensions for the custom telemetry event, they can be:
- Dictionary
Session.LogMessage(EventId: Text, Message: Text, Verbosity: Verbosity, DataClassification: DataClassification, TelemetryScope: TelemetryScope, CustomDimensions: Dictionary of [Text, Text]) - Dimension overloads
Session.LogMessage(EventId: Text, Message: Text, Verbosity: Verbosity, DataClassification: DataClassification, TelemetryScope: TelemetryScope, Dimension1: Text, Value1: Text [, Dimension2: Text] [, Value2: Text])
- Dictionary
Considerations
Several custom dimensions are automatically included in custom telemetry event sent to Application Insights. For example, generic data of the extension and the object that calls the Session.LogMessage method:
We also have information about the tenant, the extension and version that emits the event, the environment and type of environment, as well as the name of the company. Here the information of all custom dimensions by default. Default CustomDimensions
We can additionally use these custom telemetry events to:
- Identify which functionalities are or are not in use in our application
- Assist in the customer onboarding process
- Analyze processes and improve our application
Remember that we can rely on other products to optimize notifications, configuring alerts using, for example, Azure Logic Apps or Power Automate. Alert on Telemetry
Custom telemetry event definitions should be treated as an API so they should be documented, versioned, and should avoid being modified in a way that breaks a previous implementation, for example a dimension change.
Custom telemetry events must be correctly documented, guiding the response to a given event.
Example
If we want to send a custom telemetry signal with critical severity we should do something similar to the following (the code is executed in a button on an extended page).
    trigger OnAction()

    var

        CustomTelemetryDimensions: Dictionary of [Text, Text];

    begin

        CustomTelemetryDimensions.Add('dimension1', 'dimension value 1');

        CustomTelemetryDimensions.Add('dimension2', 'dimension value 2');

        Session.LogMessage('GDRGDev_CustomTelemetry_01',

            'Custom Telemetry Critical SystemMetadata: Spain hour' + FORMAT(Today()) + FORMAT(Time()),

            Verbosity::Critical,

            DATACLASSIFICATION::SystemMetadata,

            TelemetryScope::ExtensionPublisher,

            CustomTelemetryDimensions);

        Message('GDRGDev_CustomTelemetry_02 Signal sent!');

    end;
In the following link you will find the example: Blog/GDRGDev_Custom_Telemetry at main · gdrgdev/Blog (github.com), In the example, different events have been sent depending on the criticality, each one with a different EventID so that it can then be analyzed appropriately.
An event is also made with the DataClassification parameter other than SystemMetaData and as indicated above, this event is not collected in the Application Insights service for privacy reasons.
KQL
Once we have custom telemetry information collected by the Application Insights service, we can analyze it by different tools. For example Power BI or KQL as we see below.
We obtain a list of the events with the corresponding EventID code.
We display the custom and default dimensions of each custom telemetry event.
We can also group by type of event and by day, which will allow us to analyze the recurrence and execute the corresponding action steps for each of them.
In short, custom telemetry allows us to tailor monitoring to the unique needs of our extensions. Whether tracking specific events, analyzing user behavior, or measuring custom metrics, telemetry always provides us with essential information to maintain and improve our extensions.
I hope this information helps you.
Más información / More information


Replica a Telemetry in Action 🧐: Track User Activities in BC 🔍 – Gerardo Rentería Blog Cancelar la respuesta