Tracking our tenant’s storage capacity by telemetry🕵️♂️(English version)
Seguimiento de la capacidad de almacenamiento de nuestro inquilino mediante telemetría🕵️♂️
Empecemos por la importancia de monitorear la capacidad de almacenamiento en la nube de nuestros inquilinos y entornos. De esta manera, los administradores pueden identificar dónde se está utilizando demasiado espacio.
La gestión eficaz del almacenamiento es crucial, teniendo en cuenta que tenemos una capacidad limitada. El seguimiento de la capacidad de almacenamiento nos permite anticiparnos a las necesidades futuras. Así, las organizaciones pueden planificar y ajustar sus estrategias, como el almacenamiento externo (OneDrive, Servicios de Azure) o las políticas de retención de datos, lo que nos ayudaría a mejorar la gestión del espacio.
Capacidad de almacenamiento en Business Central
De forma predeterminada, los clientes de Business Central pueden utilizar 80 GB de capacidad de almacenamiento de bases de datos en todos sus entornos (producción y sandbox(3)).
- ¿Puedo adquirir más capacidad? Sí, el cliente tiene derecho a capacidad de almacenamiento adicional según la cantidad de licencias de Business Central que posee.
- ¿Puedo comprar más capacidad? Sí, el cliente puede comprar entornos y capacidad de base de datos adicionales a través de su socio. Managing Capacity – Business Central | Microsoft Learn
- ¿Qué sucede si mi tenant supera la capacidad de almacenamiento? Microsoft restringe acciones administrativas. Exceeding capacity quota – Business Central | Microsoft Learn
Opciones de almacenamiento externo:
- Integración de Business Central y OneDrive para la Empresa – Business Central | Microsoft Learn
- Integrating with Azure Blob Services – Business Central | Microsoft Learn
- Integrating with Azure File Services – Business Central | Microsoft Learn
Estrategias para una adecuada gestión de la capacidad en Business Central:
- Administrar el almacenamiento eliminando documentos o comprimiendo datos – Business Central | Microsoft Learn
- La extensión Archivo de datos – Business Central | Microsoft Learn
- Limpiar datos con directivas de retención – Business Central | Microsoft Learn
- Keeping Database Size Under the Limit – Business Central | Microsoft Learn
Nuevos eventos personalizados (telemetría)
El siguiente ejemplo tiene por objetivo la creación de 3 nuevos eventos para el seguimiento de la capacidad de nuestro tenant, su registro y explotación a través de la telemetría. La información la obtendremos de las APIs que Business Central nos propone a nivel de administración.
La solución se encuentra en Blog/GDRGDev_StorageCapacityTelemetry at main · gdrgdev/Blog (github.com), y ha sido desarrollado y compartido a modo de demostración e información.
Los eventos creados son los siguientes:
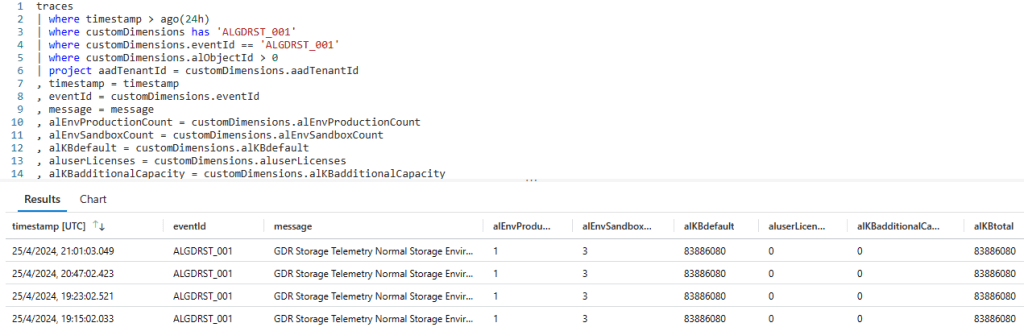
- ALGDRST_001: Informativo, tendremos la cantidad de ambientes de producción y de sandbox, la capacidad de almacenamiento en KB por defecto, la capacidad de almacenamiento adicional por cantidad de usuarios, la capacidad de almacenamiento adicional por compra y el total de la capacidad de almacenamiento en KB del tenant.
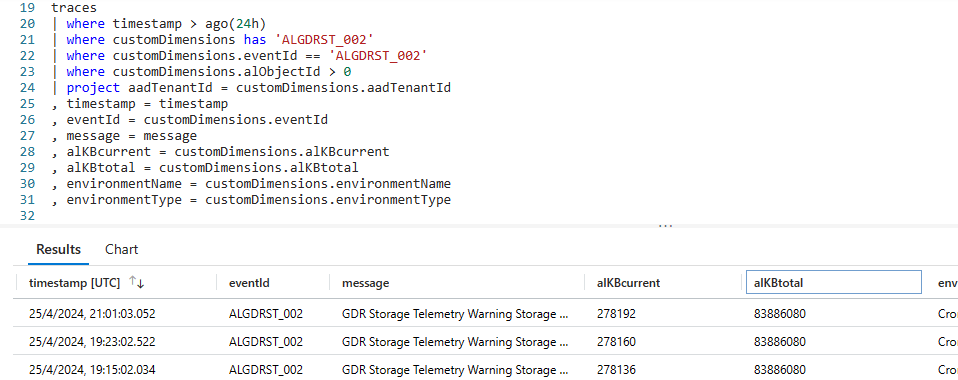
- ALGDRST_002: Advertencia, tendremos la capacidad de almacenamiento en KB actual y del tenant, si la capacidad actual se encuentra dentro del 80% y 95% de la capacidad total.
- ALGDRST_003: Crítico, tendremos la capacidad de almacenamiento en KB actual y del tenant, si la capacidad actual se encuentra superior al 95% de la capacidad total.
Como hemos indicado, nos apoyaremos en las siguientes APIs del centro de administración de Business Central:
- BC Admin Center API – Environments – Get allowed quotas | Microsoft Learn
- BC Admin Center API – Environments – Get used storage for all environments | Microsoft Learn
Adicionalmente a enviar estos eventos de telemetría a nuestro servicio de Application Insights, registraremos los valores en unas tablas, desde la página de Información de Empresa veremos el detalle de los valores de almacenamiento en KB de cada ambiente.
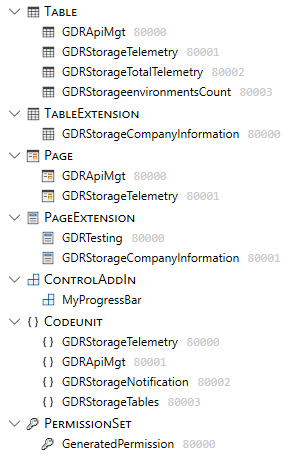
La solución tiene los siguientes objetos:
- Tablas: Configuración del API, resultados de las APIs.
- Extensión de tabla: Campos adicionales en la tabla de información de empresa.
- Páginas: Configuración del API, detalle de los ambientes y sus capacidades de almacenamiento.
- Extensión de página: Campos adicionales en la página de información de empresa, y pruebas de las APIs.
- Control Add-In: Nos permitirá ver visualmente la capacidad actual.
- Codeunits: Conexión a las APIs, notificación, registro de las tablas y envío de las señales de telemetría.
Configuraciones en Business Central
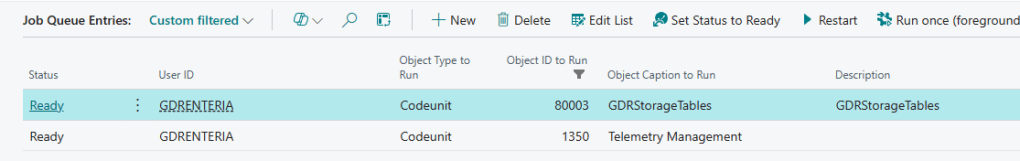
Configuramos en la cola de proyectos, la codeunit que se encargará de trabajar con las APIs diariamente y registrar los valores en las tablas internas. De igual manera debemos revisar si es que tenemos habilitada y funcionando la codeunit 1350 responsable de enviar las señales de telemetría a nuestro servicio de Application Insights diariamente. De igual manera, la página de configuración de API tiene que tener nuestros datos de conexión.


En la siguiente codeunit tenemos las suscripciones a la codeunit de administración de Telemetria (1350), que se encargará de enviar los eventos de telemetría de información, y de ser el caso, los eventos de telemetría de advertencia y críticos.

Pantallas en Business Central
Cuando se hayan ejecutado las colas de proyecto de manera exitosa, iremos a la página de información de empresa, y veremos un apartado nuevo donde veremos un nuevo FactBox que nos muestra los valores de los ambientes y sus capacidades de almacenamiento utilizadas en KB. Además de un par de barras de progreso que nos indican de manera visual la utilización de los 4 ambientes disponibles en el tenant, y en porcentaje el consumo de la capacidad actual con relación a la capacidad total. Para la barra de progreso he utilizado un add-in que puedes encontrarlo aquí:
https://github.com/hougaard/Youtube-Video-Sources/tree/master/progressbar2

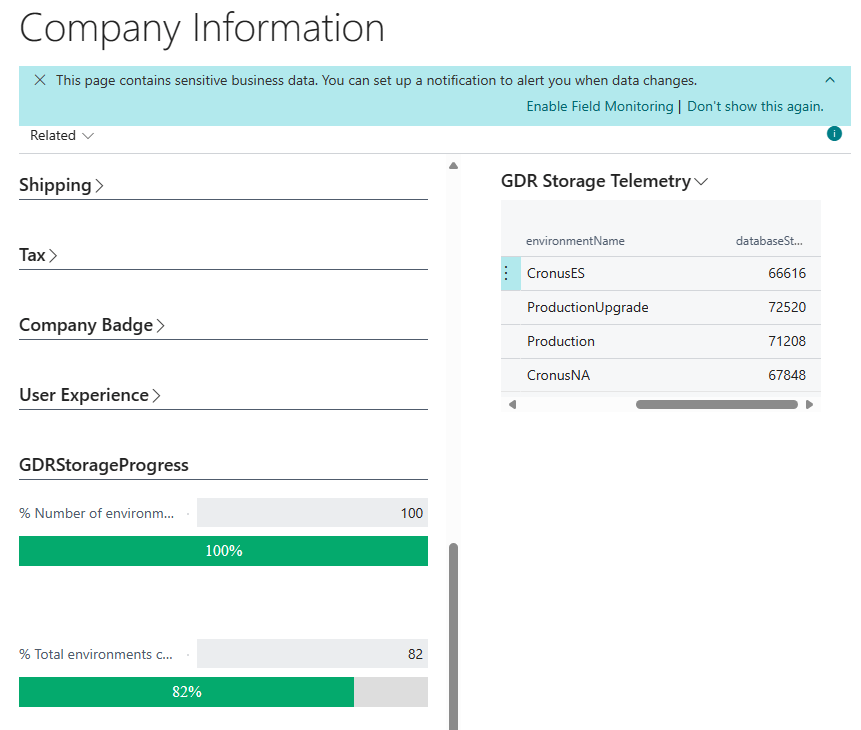
Cuando superamos la capacidad actual el 95% del total de capacidad permitida, tendremos en la parte superior de la página una notificación y un enlace para acceder directamente al centro de administración de Business Central.


Eventos de telemetría
Aquí comparto el archivo KQL de los nuevos eventos: Blog/GDRGDev_StorageCapacityTelemetry/GDRGDev_SCT.kql at main · gdrgdev/Blog (github.com)
traces
| where timestamp > ago(3h)
| where customDimensions has 'ALGDRST_001'
| where customDimensions.eventId == 'ALGDRST_001'
| where customDimensions.alObjectId > 0
| project aadTenantId = customDimensions.aadTenantId
, timestamp = timestamp
, eventId = customDimensions.eventId
, message = message
, alEnvProductionCount = customDimensions.alEnvProductionCount
, alEnvSandboxCount = customDimensions.alEnvSandboxCount
, alKBdefault = customDimensions.alKBdefault
, aluserLicenses = customDimensions.aluserLicenses
, alKBadditionalCapacity = customDimensions.alKBadditionalCapacity
, alKBtotal = customDimensions.alKBtotal
, environmentName = customDimensions.environmentName
, environmentType = customDimensions.environmentType
traces
| where timestamp > ago(3h)
| where customDimensions has 'ALGDRST_002'
| where customDimensions.eventId == 'ALGDRST_002'
| where customDimensions.alObjectId > 0
| project aadTenantId = customDimensions.aadTenantId
, timestamp = timestamp
, eventId = customDimensions.eventId
, message = message
, alKBcurrent = customDimensions.alKBcurrent
, alKBtotal = customDimensions.alKBtotal
, environmentName = customDimensions.environmentName
, environmentType = customDimensions.environmentType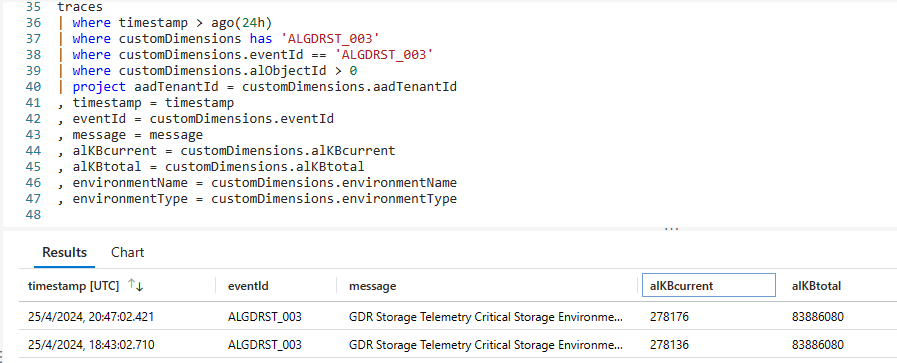
traces
| where timestamp > ago(3h)
| where customDimensions has 'ALGDRST_003'
| where customDimensions.eventId == 'ALGDRST_003'
| where customDimensions.alObjectId > 0
| project aadTenantId = customDimensions.aadTenantId
, timestamp = timestamp
, eventId = customDimensions.eventId
, message = message
, alKBcurrent = customDimensions.alKBcurrent
, alKBtotal = customDimensions.alKBtotal
, environmentName = customDimensions.environmentName
, environmentType = customDimensions.environmentType
Alertas de los eventos de telemetría
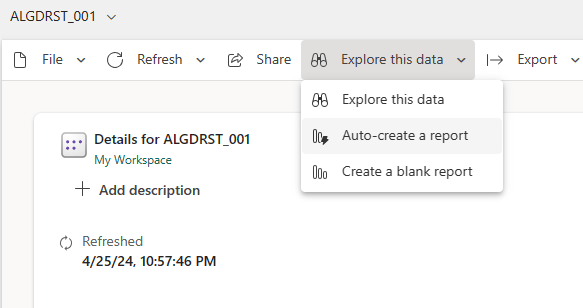
Contamos con varias herramientas de explotación de la información de telemetría y de la gestión de alertas. En este caso, aprovecharé la facilidad que nos brinda el servicio de Application Insights de Azure de crear directamente un nuevo Dataset para Power Bi.

Pero, podríamos aprovechar como he mencionado muchas otras herramientas:
- BCTech/samples/AppInsights/Alerts at master · microsoft/BCTech (github.com)
- BCTech/samples/AppInsights/PowerAutomate at master · microsoft/BCTech (github.com)
- BCTech/samples/AppInsights/PowerBI at master · microsoft/BCTech (github.com)
Espero que esta información te ayude.
Tracking our tenant’s storage capacity by telemetry 🕵️♂️
Let’s start with the importance of monitoring the cloud storage capacity of our tenants and environments. This way, administrators can identify where too much space is being used.
Effective storage management is crucial, considering we have limited capacity. Monitoring storage capacity allows us to anticipate future needs. Thus, organizations can plan and adjust their strategies, such as external storage (OneDrive, Azure Services) or data retention policies, which would help us improve space management.
Storage capacity in Business Central
By default, Business Central customers can use 80 GB of database storage capacity across all their environments (production and sandbox(3)).
- Can I gain more capacity? Yes, the customer is entitled to additional storage capacity based on the number of Business Central licenses they own.
- Can I buy more capacity? Yes, customer can purchase additional environments and database capacity through their partner. Managing Capacity – Business Central | Microsoft Learn
- What happens if my tenant exceeds storage capacity? Microsoft restricts administrative actions. Exceeding capacity quota – Business Central | Microsoft Learn
External storage options:
- Business Central and OneDrive for Business Integration – Business Central | Microsoft Learn
- Integrating with Azure Blob Services – Business Central | Microsoft Learn
- Integrating with Azure File Services – Business Central | Microsoft Learn
Strategies for proper capacity management in Business Central:
- Manage Storage by Deleting Documents or Compressing Data – Business Central | Microsoft Learn
- The Data Archive Extension – Business Central | Microsoft Learn
- Clean Up Data with Retention Policies – Business Central | Microsoft Learn
- Keeping Database Size Under the Limit – Business Central | Microsoft Learn
New custom events (telemetry)
The following example aims to create 3 new events to monitor the capacity of our tenant, its registration and exploitation through telemetry. We will obtain the information from the APIs that Business Central proposes to us at the administration level.
The solution is found in Blog/GDRGDev_StorageCapacityTelemetry at main · gdrgdev/Blog (github.com), and has been developed and shared for demonstration and information purposes.
The events created are the following:
- ALGDRST_001: Informatively, we will have the number of production and sandbox environments, the default storage capacity in KB, the additional storage capacity per number of users, the additional storage capacity per purchase and the total storage capacity in KB of the tenant.
- ALGDRST_002: Warning, we will have the current and tenant storage capacity in KB, if the current capacity is between 80% and 95% of the total capacity.
- ALGDRST_003: Critically, we will have the current and tenant storage capacity in KB, if the current capacity is greater than 95% of the total capacity.
As we have indicated, we will rely on the following APIs from the Business Central administration center:
- BC Admin Center API – Environments – Get allowed quotas | Microsoft Learn
- BC Admin Center API – Environments – Get used storage for all environments | Microsoft Learn
In addition to sending these telemetry events to our Application Insights service, we will record the values in tables; from the Company Information page we will see the details of the storage values in KB of each environment.
The solution has the following objects:
- Tables: API configuration, API results.
- Table extension: Additional fields in the company information table.
- Pages: API configuration, details of the environments and their storage capacities.
- Page extension: Additional fields on the company information page, and API testing.
- Add-In Control: It will allow us to visually see the current capacity.
- Codeunits: Connection to APIs, notification, registration of tables and sending of telemetry signals.
Settings in Business Central
We configure the codeunit in the job queue that will be responsible for working with the APIs daily and registering the values in the internal tables. Likewise, we must check if we have the 1350 codeunit responsible for sending telemetry signals to our Application Insights service enabled and working on a daily basis. Likewise, the API configuration page has to have our connection data.
In the next codeunit we have the subscriptions to the Telemetry Management codeunit (1350), which will be responsible for sending information telemetry events, and if applicable, warning and critical telemetry events.
Pages in Business Central
When the job queues have been executed successfully, we will go to the company information page, and we will see a new FactBox that shows us the values of the environments and their storage capacities used in KB. In addition to a couple of progress bars that visually indicate the use of the 4 environments available in the tenant, and in percentage the consumption of the current capacity in relation to the total capacity. For the progress bar I used an add-in that you can find here:
https://github.com/hougaard/Youtube-Video-Sources/tree/master/progressbar2
When we exceed the current capacity 95% of the total allowed capacity, we will have a notification at the top of the page and a link to directly access the Business Central administration center.
Telemetry events
Here I share the KQL file of the new events: Blog/GDRGDev_StorageCapacityTelemetry/GDRGDev_SCT.kql at main · gdrgdev/Blog (github.com)
traces
| where timestamp > ago(3h)
| where customDimensions has 'ALGDRST_001'
| where customDimensions.eventId == 'ALGDRST_001'
| where customDimensions.alObjectId > 0
| project aadTenantId = customDimensions.aadTenantId
, timestamp = timestamp
, eventId = customDimensions.eventId
, message = message
, alEnvProductionCount = customDimensions.alEnvProductionCount
, alEnvSandboxCount = customDimensions.alEnvSandboxCount
, alKBdefault = customDimensions.alKBdefault
, aluserLicenses = customDimensions.aluserLicenses
, alKBadditionalCapacity = customDimensions.alKBadditionalCapacity
, alKBtotal = customDimensions.alKBtotal
, environmentName = customDimensions.environmentName
, environmentType = customDimensions.environmentType
traces
| where timestamp > ago(3h)
| where customDimensions has 'ALGDRST_002'
| where customDimensions.eventId == 'ALGDRST_002'
| where customDimensions.alObjectId > 0
| project aadTenantId = customDimensions.aadTenantId
, timestamp = timestamp
, eventId = customDimensions.eventId
, message = message
, alKBcurrent = customDimensions.alKBcurrent
, alKBtotal = customDimensions.alKBtotal
, environmentName = customDimensions.environmentName
, environmentType = customDimensions.environmentType
traces
| where timestamp > ago(3h)
| where customDimensions has 'ALGDRST_003'
| where customDimensions.eventId == 'ALGDRST_003'
| where customDimensions.alObjectId > 0
| project aadTenantId = customDimensions.aadTenantId
, timestamp = timestamp
, eventId = customDimensions.eventId
, message = message
, alKBcurrent = customDimensions.alKBcurrent
, alKBtotal = customDimensions.alKBtotal
, environmentName = customDimensions.environmentName
, environmentType = customDimensions.environmentType
Telemetry Event Alerts
We have several tools for exploiting telemetry information and alert management. In this case, I will take advantage of the facility that the Azure Application Insights service gives us to directly create a new Dataset for Power Bi.
But, we could take advantage of many other tools, as I have mentioned:
- BCTech/samples/AppInsights/Alerts at master · microsoft/BCTech (github.com)
- BCTech/samples/AppInsights/PowerAutomate at master · microsoft/BCTech (github.com)
- BCTech/samples/AppInsights/PowerBI at master · microsoft/BCTech (github.com)
I hope this information helps you.
Más información / More information:
- How do I use Power Automate to query telemetry in Azure Application Insights?
- Telemetry with Power Automate – how to get the report directly on your mailbox – M y N A V B l o g . com
- Alert on Telemetry – Business Central | Microsoft Learn
- Using Power Automate for telemetry alerts | MSDyn365 Business Central – Tom Kapitan (kepty.cz)


Deja un comentario