
Analyzing some user actions through telemetry (English Version) 💡
Analizando algunas acciones de los usuarios a través de la telemetría 💡
En telemetría, los eventos de los clientes son esenciales para comprender cómo interactúan con el sistema e identificar cualquier problema o áreas potenciales de mejora. Las organizaciones pueden optimizar la experiencia del usuario, aumentar la usabilidad general del sistema y mejorar el rendimiento mediante el estudio de estos sucesos. Available Telemetry – Client Events.
Actualmente los eventos de clientes que son capturados por la telemetría están referidos a acciones como cuando un usuario abre una página o un query, cuando un usuario selecciona una acción determinada en una página, como puede ser el activar o desactivar el modo de análisis desde una página de tipo lista, o cuando un usuario ante un mensaje de error encuentra que la información que se le brinda le es útil o no.
Abrir páginas o queries
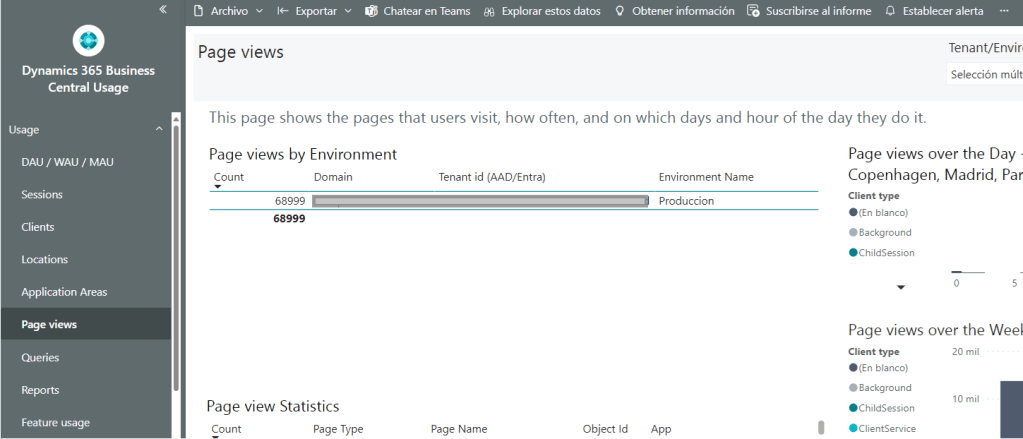
Este evento de telemetría recopila datos sobre las páginas o queries que los usuarios abren en Business Central. Nos indica cuánto tiempo llevó abrir la página, la frecuencia de ejecución de dicha acción, que días y horas son abiertas, además de información sobre el entorno del usuario, y muchos más datos.
Esta información estadística nos permite solucionar problemas de rendimiento causados por los entornos de los usuarios.
Podemos ver un ejemplo de un código KQL que nos ayudará a analizar la información: BCTech/samples/AppInsights/KQL/Queries/ExampleQueriesForEachArea/PageViews.kql
La telemetría de vista de página se registra en la tabla pageViews en lugar de en la tabla de traces, como ocurre con otros seguimientos de Business Central.
Los campos que tenemos para analizar en esta traza se encuentran aquí: Azure Monitor Logs reference – pageViews

La telemetría del uso de queries utiliza las mismas dimensiones de las páginas. La dimensión personalizada pageDataSourceType se establece en el valor Query, que es la única diferencia.

Esta información también puede ser visualizada por la aplicación de Power BI de BC Usage.

Calidad en el mensaje de error
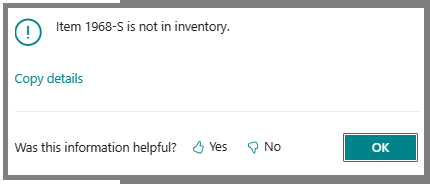
Los mensajes de error generados por llamadas a los métodos Error(String) y Error(ErrorInfo) tienen una funcionalidad de votación. Aparece una pregunta de sí o no sobre si el mensaje fue útil cuando un usuario recibe un mensaje de error en Business Central.
Este evento de telemetría recopila datos si el usuario elige Sí o No. Los partners y desarrolladores pueden utilizar esta información para obtener información sobre los mensajes de error que los usuarios pueden encontrar difíciles de comprender. Por lo que posteriormente pueden ayudar al cliente optimizando el mensaje que se quiere transmitir.
Podemos ver un ejemplo de un código KQL que nos ayudará a analizar la información: BCTech/samples/AppInsights/KQL/Queries/ExampleQueriesForEachArea/Errors.kql
Como podemos ver en la siguiente imagen, nos brinda información relacionada al entorno, al mensaje del error, la extensión donde está el mensaje, la traza del error ocurrido y la respuesta del usuario a la votación.

Acción de cliente
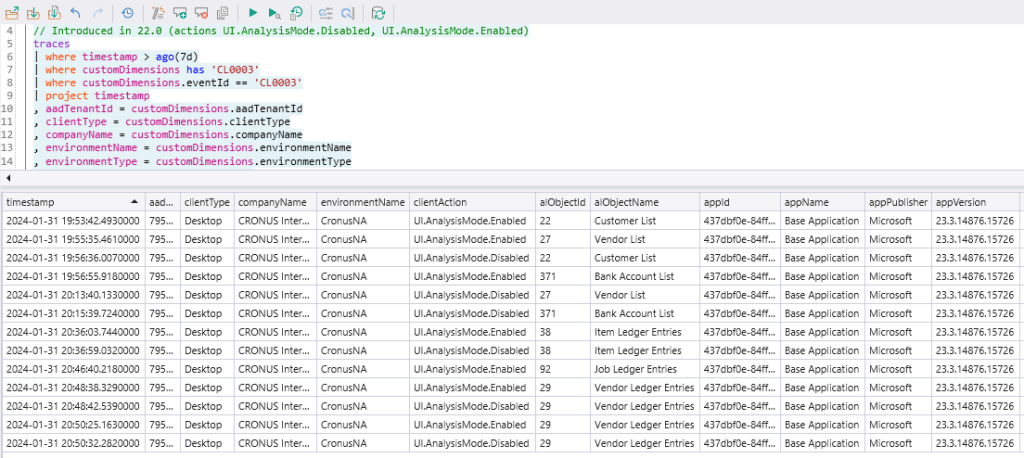
Este evento de telemetría recopila datos cuando se activa una acción en una página. Cada evento de acción le proporciona detalles sobre el tipo de acción, la página en la que se inició, el entorno del usuario, la extensión que contiene la página y horario de la ejecución de la acción.
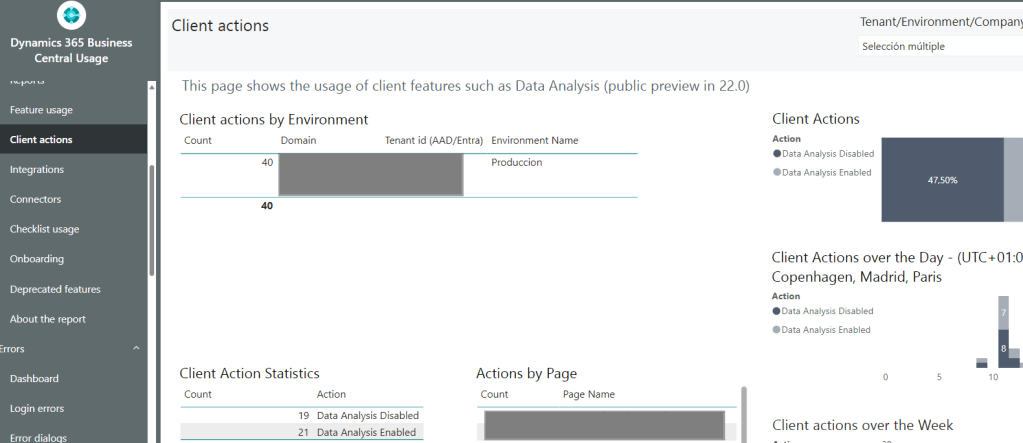
Esta información nos permite obtener estadísticas sobre el uso del usuario de las características del sistema, como activar o desactivar el modo de análisis de una página de tipo lista.
Podemos ver un ejemplo de un código KQL que nos ayudará a analizar la información: BCTech/samples/AppInsights/KQL/Queries/ExampleQueriesForEachArea/ClientActions.kql
Esta información también puede ser visualizada por la aplicación de Power BI de BC Usage.
Merece que identifiquemos estos eventos de telemetría porque es un camino muy útil para identificar el comportamiento del usuario ante situaciones que queremos medir. No dudo que en el futuro se irán incrementando las acciones y eventos similares a los mencionados.
Espero que esta información te ayude.
Analyzing some user actions through telemetry 💡
In telemetry, customer events are essential to understanding how they interact with the system and identifying any issues or potential areas for improvement. Organizations can optimize the user experience, increase overall system usability, and improve performance by studying these events. Available Telemetry – Client Events.
Currently, customer events that are captured by telemetry refer to actions such as when a user opens a page or a query, when a user selects a specific action on a page, such as activating or deactivating the analysis mode from a list type page, or when a user, faced with an error message, finds that the information provided is useful or not.
Opening pages or queries
This telemetry event collects data about the pages or queries that users open in Business Central. It tells us how long it took to open the page, the frequency of execution of said action, what days and hours they are open, as well as information about the user’s environment, and much more data.
This statistical information allows us to troubleshoot performance issues caused by user environments.
We can see an example of a KQL code that will help us analyze the information: BCTech/samples/AppInsights/KQL/Queries/ExampleQueriesForEachArea/PageViews.kql
Page view telemetry is recorded in the pageViews table instead of the trace table, as is the case with other Business Central traces.
The fields that we have to analyze in this trace are found here: Azure Monitor Logs reference – pageViews
The query usage telemetry uses the same page dimensions. The pageDataSourceType custom dimension is set to the Query value, which is the only difference.
This information can also be viewed by the BC Usage Power BI application.
Quality in the error message
Error messages generated by calls to the Error(String) and Error(ErrorInfo) methods have voting functionality. A yes or no question about whether the message was helpful when a user receives an error message in Business Central.
This telemetry event collects data if the user chooses Yes or No. Partners and developers can use this information to learn about error messages that users may find difficult to understand. So they can later help the client by optimizing the message they want to convey.
We can see an example of a KQL code that will help us analyze the information: BCTech/samples/AppInsights/KQL/Queries/ExampleQueriesForEachArea/Errors.kql
As we can see in the following image, it provides us with information related to the environment, the error message, the extension where the message is, the trace of the error that occurred and the user’s feedback to the vote.
Client action
This telemetry event collects data when an action is triggered on a page. Each action event provides you with details about the type of action, the page on which it was started, the user’s environment, the extension containing the page, and the time the action was executed.
This information allows us to obtain statistics about the user’s use of system features, such as activating or deactivating the analysis mode of a list-type page.
We can see an example of a KQL code that will help us analyze the information: BCTech/samples/AppInsights/KQL/Queries/ExampleQueriesForEachArea/ClientActions.kql
This information can also be viewed by the BC Usage Power BI application.
It is worth identifying these telemetry events because it is a very useful way to identify user behavior in situations that we want to measure. I have no doubt that actions and events similar to those mentioned will increase in the future.
I hope this information helps you.
Más información / More information:
- New telemetry events and data | Microsoft Learn
- Available Telemetry – Business Central | Microsoft Learn
- Page View Telemetry – Business Central | Microsoft Learn
- Analyzing client action telemetry – Business Central | Microsoft Learn
- Analyzing Error Message Vote Telemetry – Business Central | Microsoft Learn


Deja un comentario