
Use additional logging to analyze all SQL queries using telemetry (English version)
Usa el registro adicional para analizar todas las consultas SQL mediante telemetría
Ante un problema que amerite una revisión más extensa o profunda, tenemos la posibilidad de revisar y analizar todas las consultas SQL, incluso aquellas que podrían tardar poco en ejecutarse pero que ocurren con frecuencia.
Este tipo de análisis detallado es principalmente solicitado por un partner o por un representante de soporte de Microsoft, se habilita para una sesión específica, y estará vigente hasta que el usuario cierre el navegador, cierre sesión o transcurra 15 minutos.
Lo habilitamos desde la página de ayuda y soporte en el cliente.
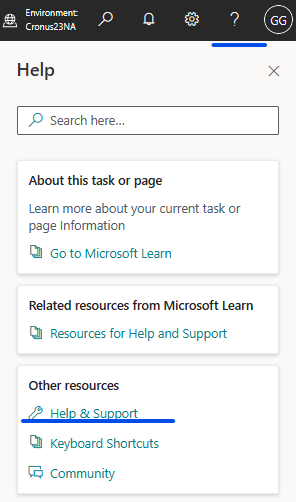
Nos dirigimos a la sección de solución de problemas y seleccionamos la habilitación del registro adicional.

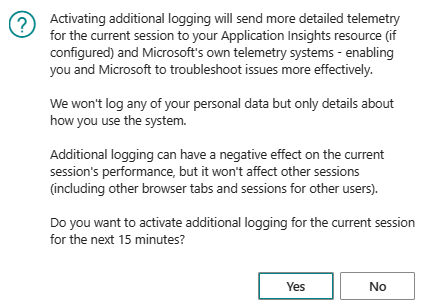
Nos advierte se enviará información adicional superior a la normal de todas las operaciones que hagamos durante el tiempo que esté habilitada la funcionalidad, todos estos datos de telemetría se enviarán al servicio de Application Insights configurado en el centro de administración de Business Central en el ambiente del tenant. Environment Telemetry in the Business Central administration
Nos advierten también que el rendimiento se verá afectado en la sesión actual, además de indicarnos que durará esta habilitación los siguientes 15 minutos.
Cuando aceptamos las premisas nos informa que se ha habilitado la funcionalidad, por lo que podemos ejecutar las operaciones que merezcan ser atendidas y revisadas con mayor profundidad y detalle.

Ejemplo
Antes de habilitar la opción ejecutando los pasos mencionados anteriormente, vamos a apoyarnos en una sentencia KQL para identificar las sentencias SQL que son enviadas por telemetría. waldo.BCTelemetry/Usage/UsagePerEventId.kql.
Por lo pronto vemos que no llegan todas las sentencias SQL, solo llegan las sentencias con gran exigencia en tiempo tal como es el comportamiento habitual de la telemetría.

Ahora habilitamos la telemetría detallada para la siguiente sesión:

Podemos validar que la telemetría detallada ha sido habilitada mediante una sentencia KQL, aquí el ejemplo: ExampleQueriesForEachArea/VerboseTelemetry.kql
Verificamos los eventos relacionados a la habilitación de la telemetría detallada, los eventos son los RT0023 y RT0024, Analyzing Verbose Telemetry, visualizamos que se ha habilitado la telemetría detallada para la sesión mencionada.

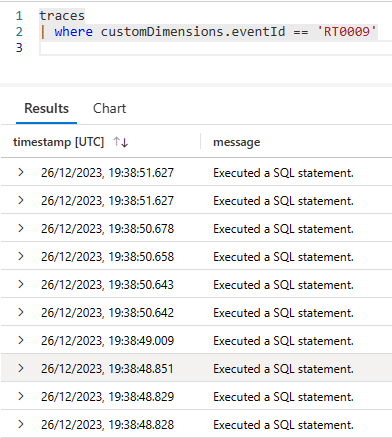
Ahora analizamos y vemos que se han enviado mucha más información de telemetría, con el ID de evento RT0009 tenemos todas las sentencias SQL ejecutadas. En el ejemplo vemos 190 sentencias SQL ejecutadas.

Las operaciones que realicé en business central estuvieron relacionadas al módulo de ventas, ver el listado de pedidos de ventas, abrir una de ellas, seleccionar la opción de estadísticas y vemos que se ha enviado las sentencias de cada una de las operaciones realizadas.
Podemos sumar el tiempo invertido en ellas y analizar el resultado, identificando puntos de atención y control.

Luego de 15 minutos validamos que la telemetría detallada ha sido deshabilitada mediante una sentencia KQL, aquí el ejemplo: ExampleQueriesForEachArea/VerboseTelemetry.kql

Como nota final para implementaciones del tipo On-Premise podemos replicar este comportamiento cambiando el umbral que define las consultas de larga duración. Monitoring Long Running SQL Queries to the Event Log – Business Central | Microsoft Learn
Espero que esta información te ayude.
Use additional logging to analyze all SQL queries using telemetry
When faced with a problem that warrants a more extensive or in-depth review, we have the possibility of reviewing and analyzing all SQL queries, even those that may take a short time to execute but occur frequently.
This type of detailed analysis is primarily requested by a partner or Microsoft support representative, is enabled for a specific session, and will be in effect until the user closes the browser, logs out, or 15 minutes have passed.
We enable it from the help and support page in the client.
We go to the troubleshooting section and select enabling additional logging.
It warns us that additional information above normal will be sent for all the operations we perform during the time the functionality is enabled, all this telemetry data will be sent to the Application Insights service configured in the Business Central administration center in the environment of the tenant. Environment Telemetry in the Business Central administration
They also warn us that performance will be affected in the current session, in addition to indicating that this enablement will last for the next 15 minutes.
When we accept the premises, it informs us that the functionality has been enabled, so we can execute the operations that deserve to be attended to and reviewed in greater depth and detail.
Example
Before enabling the option by executing the steps mentioned above, we are going to rely on a KQL statement to identify the SQL statements that are sent by telemetry. waldo.BCTelemetry/Usage/UsagePerEventId.kql.
For now we see that not all SQL statements arrive, only the long running SQL statements with great demands on time arrive, as is the usual behavior of telemetry.
We now enable additional logging for the next session:
We can validate that verbose telemetry has been enabled using a KQL statement, here is the example: ExampleQueriesForEachArea/VerboseTelemetry.kql
We verify the events related to the enabling/desabling of verbose telemetry, the events are RT0023 and RT0024, Analyzing Verbose Telemetry, we see that verbose telemetry has been enabled for the mentioned session.
Now we analyze and see that much more telemetry information has been sent, with event ID RT0009 we have all the SQL statements executed. In the example we see 190 SQL statements executed.
The operations that I carried out in business central were related to the sales module, see the list of sales orders, open one of them, select the statistics option and we see that the sql sentences for each of the operations carried out have been sent to the application insights service.
We can summarize the time invested in them and analyze the result, identifying points of attention and control.
After 15 minutes we validate that verbose telemetry has been disabled through a KQL statement, here is the example: ExampleQueriesForEachArea/VerboseTelemetry.kql
As a final note for On-Premise implementations we can replicate this behavior by changing the threshold that defines long-running queries. Monitoring Long Running SQL Queries to the Event Log – Business Central | Microsoft Learn
I hope this information helps you.
Más información / More information:


Deja un comentario