Optimizing Performance in Visual Studio Code (English Version)
Optimización del rendimiento en Visual Studio Code
Si mientras desarrollamos experimentamos problemas de rendimiento, lentitud y bloqueos es importante analizar y encontrar el origen del problema para intentar resolverlo.
Las siguientes acciones buscan como objetivo el encontrar el problema y resolverlo o mitigarlo.
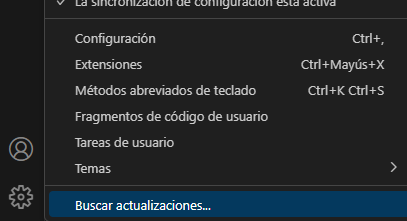
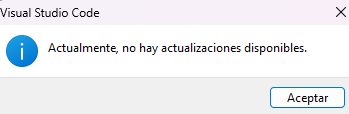
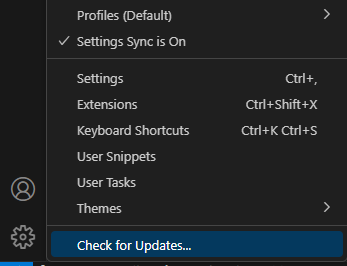
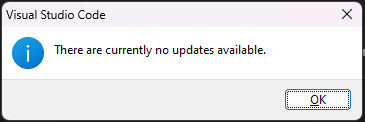
En primer lugar es muy importante verificar que tengamos instalada la última versión de Visual Studio Code (VSC). Para esto debemos ir a la siguiente opción en VSC y buscar las actualizaciones. Y esperar que tengamos la última instalada. Más información: VSC Updates
Identifiquemos que cumplamos los requerimientos mínimos de uso. Requerimientos para VSC
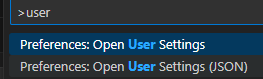
Revisar configuraciones
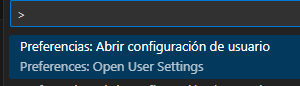
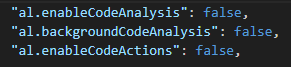
Podemos probar con la deshabilitación de algunas configuraciones que son exigentes en su uso. Como lo podrían ser:
- «al.enableCodeAnalysis»: false
- «al.backgroundCodeAnalysis»: false si «al.enableCodeAnalysis»: true.
- «al.enableCodeActions»: false
- «al.incrementalBuild»: true
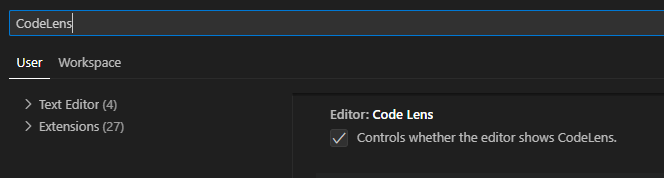
- «editor.codeLens»: false Code Lens para donde se usa
- «[al]»: {«editor.formatOnSave»: false }
Más información: Optimize Visual Studio Code for AL Development

Deshabilitar Extensiones
Existen buenas extensiones y nos apoyamos mucho en ellas pero en caso de un rendimiento degradado es necesario analizarlas. Y hacernos algunas preguntas:
- ¿Cuántas extensiones tenemos instaladas?
- ¿Con cuántas extensiones trabajamos?
- ¿Cuáles podría desinstalar?
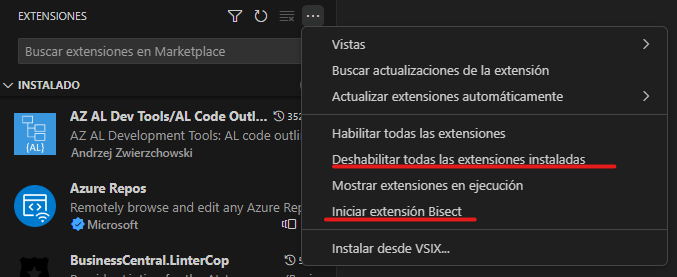
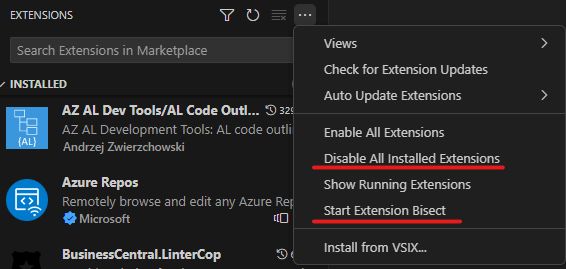
Una prueba podría ser analizar el rendimiento sin extensiones, para eso tenemos la posibilidad de deshabilitar todas las extensiones. Luego ir probando la habilitación una a una hasta encontrar la extensión que nos causa el problema. Existe una funcionalidad también llamada «Extensión Bisect» que ejecuta una búsqueda binaria en las extensiones instaladas, deshabilitando algunas, hasta encontrar la extensión con problema. Resolving extension issues with bisect
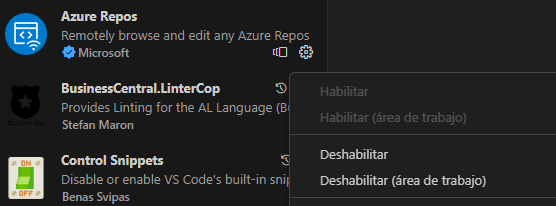
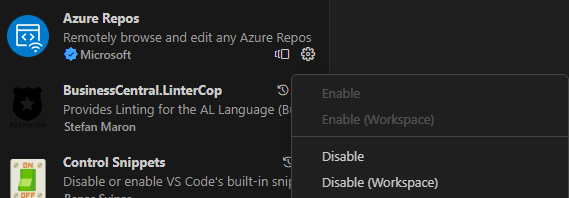
Además podemos deshabilitar individualmente las extensiones hasta por área de trabajo.
Rendimiento de Inicio
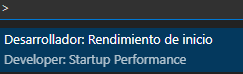
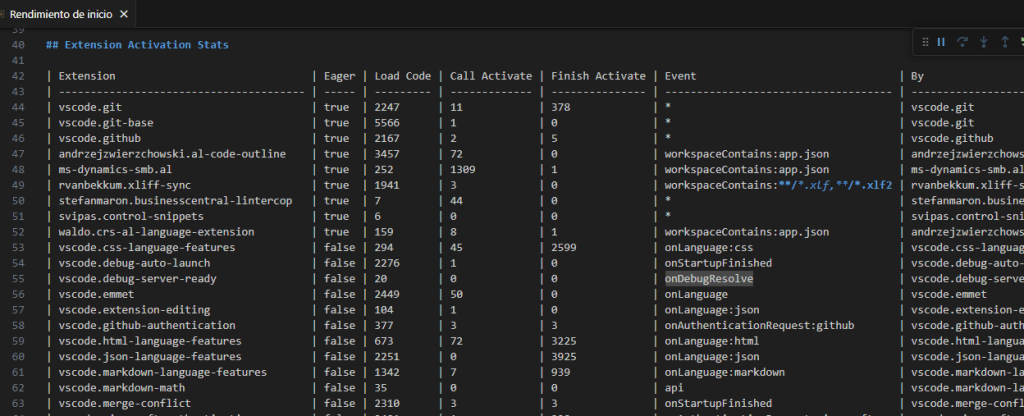
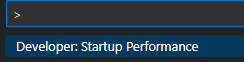
También podemos revisar los temporizadores de arranque si VSC parece iniciarse lentamente. Presionamos F1 y luego seleccionamos la opción «Rendimiento de Inicio». Al hacerlo, se abrirá un editor con información completa sobre el rendimiento.
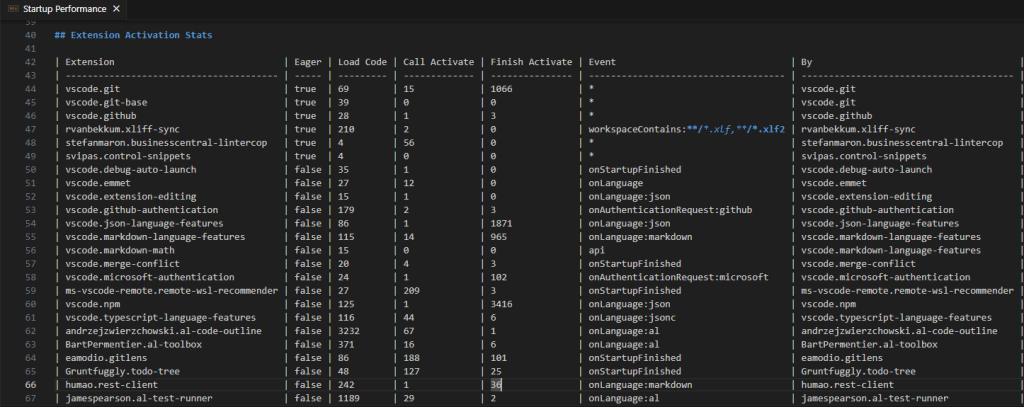
En la sección de extensiones visualizamos las extensiones entre externas y propias del VSC que se cargan al iniciarse.
Mostrar Extensiones en Ejecución
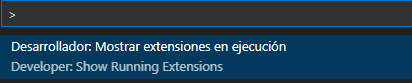
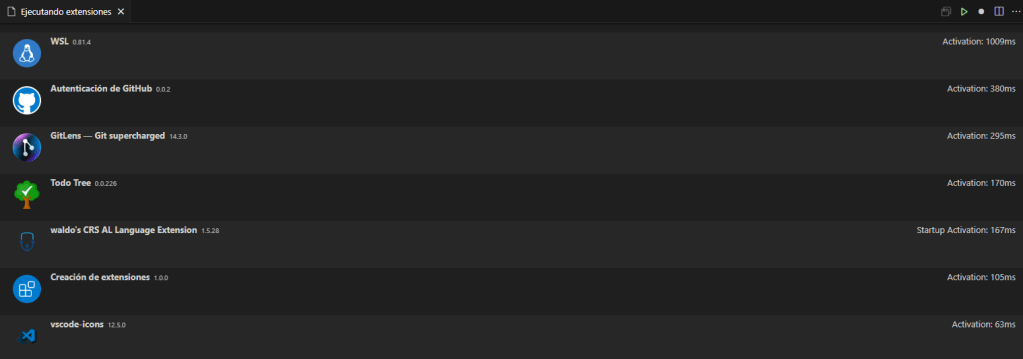
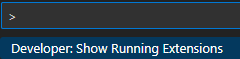
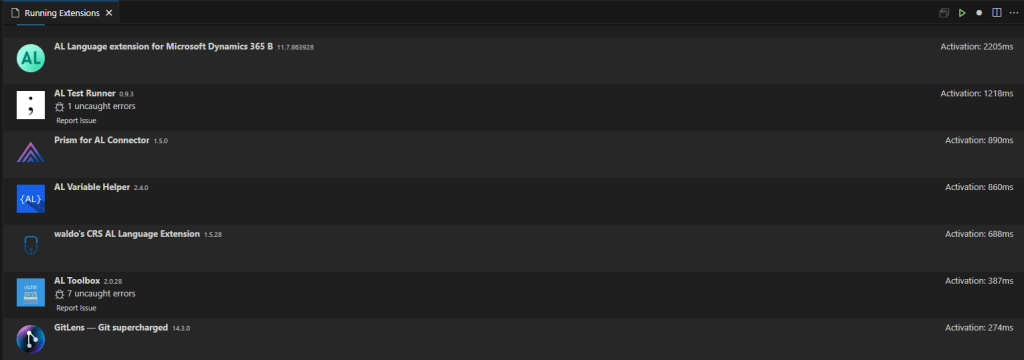
Puedes ver los tiempos exactos de inicio de cada una de tus extensiones en VSC gracias a esta gran función. Presionamos F1 y luego seleccionamos la opción «Mostrar extensiones en ejecución»
Lo primero que puede ver en esta pestaña es el tiempo de activación de inicio. Te indica el tiempo que ha tardado cada extensión en activarse. Desde aquí también se puede crear un perfil de CPU y compartirlo con el autor de la extensión.
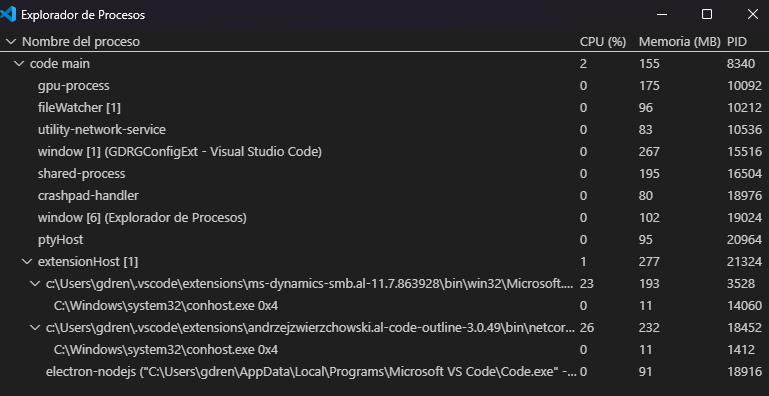
Explorador de Procesos
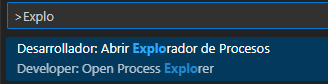
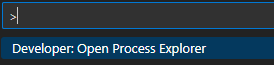
Podemos acceder a esta herramienta de diágnostico presionando F1 y luego seleccionamos la opción «Abrir Explorador de Procesos»
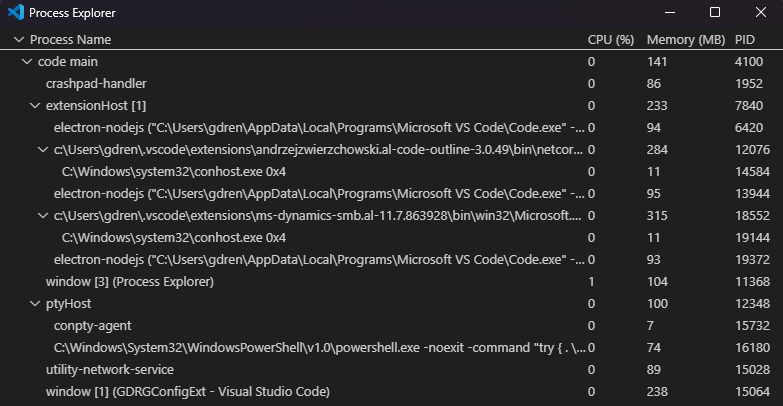
Un problema con una extensión es frecuentemente la fuente de un alto uso de CPU. El proceso Extension Host ejecuta extensiones mientras VSC otros varios procesos. Podemos visualizar el uso de memoria y CPU y determinar un plan de acción con dicha extensión.
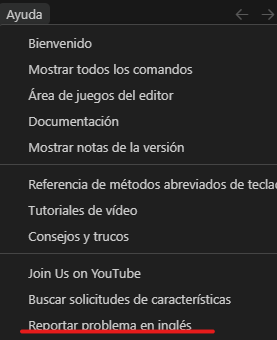
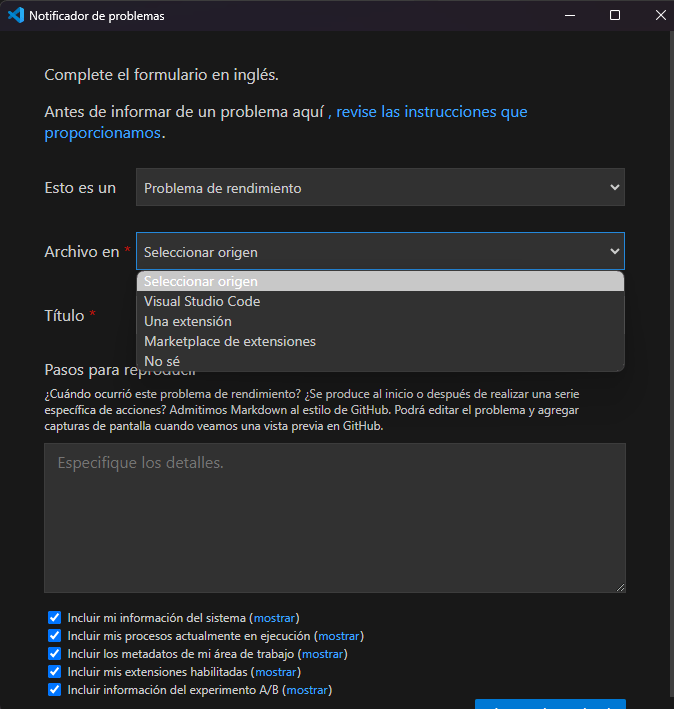
Reportar Problema
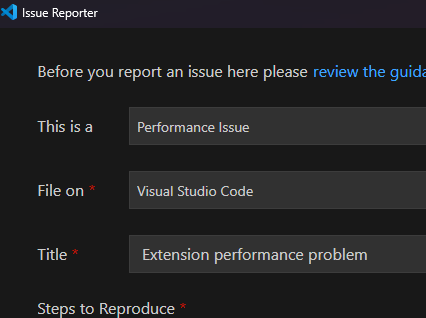
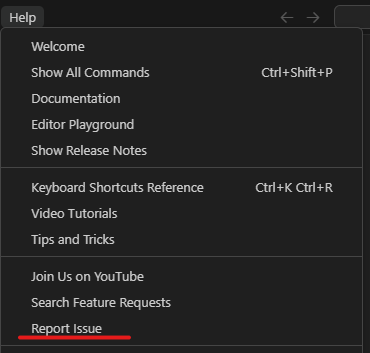
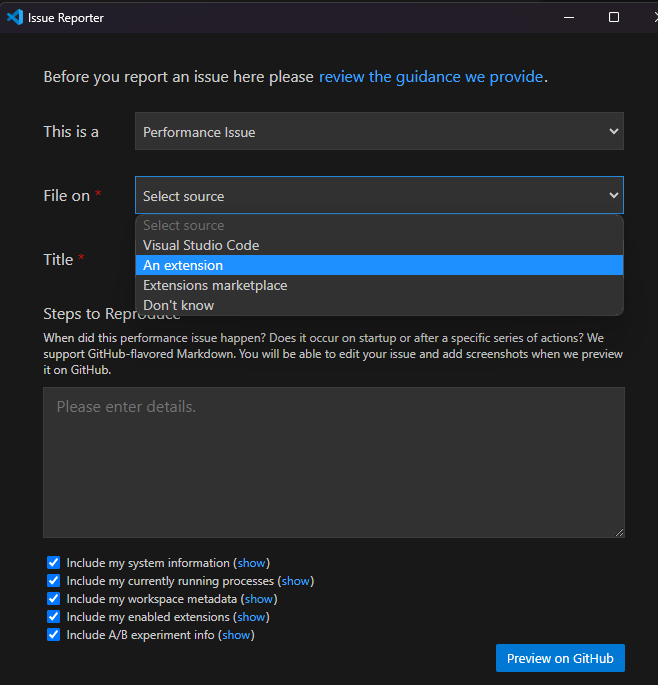
Adicionalmente a lo mencionado, podemos reportar un problema de rendimiento, para eso debemos acceder al menú Ayuda y la opción de «Reportar Problema», indicar que es un problema de rendimiento, seleccionar el origen y completar con detalles del comportamiento que experimentamos.
Espero que te haya sido útil esta información si estás creando una extensión de VSC para encontrar y resolver problemas de rendimiento.
Optimizing Performance in Visual Studio Code
If while developing we experience performance problems, slowness and crashes, it is important to analyze and find the source of the problem in order to try to solve it.
The following actions are aimed at finding the problem and solving or mitigating it.
First of all it is very important to verify that we have installed the latest version of Visual Studio Code (VSC). For this we must go to the following option in VSC and look for updates. And wait that we have the last one installed. More information about VSC: VSC Updates
Identify that we meet the minimum requirements of use. Requirements for Visual Studio Code
Review settings
We can try disabling some settings that are demanding in their use. Such as:
- «al.enableCodeAnalysis»: false
- «al.backgroundCodeAnalysis»: false if «al.enableCodeAnalysis»: true.
- «al.enableCodeActions»: false
- «al.incrementalBuild»: true
- «editor.codeLens»: false Code Lens for where used
- «[al]»: {«editor.formatOnSave»: false }
More information: Optimize Visual Studio Code for AL Development
Disable Extensions
There are great extensions and we rely on them a lot but in case of degraded performance it is necessary to analyze them. And ask ourselves some questions:
- How many extensions do we have installed?
- How many extensions do we work with?
- Which ones could I uninstall?
A test could be to analyze the performance without extensions, for that we have the possibility to disable all extensions. Then, we can test the enabling one by one until we find the extension that is causing the problem. There is also a feature called «Extension Bisect» that runs a binary search in the installed extensions, disabling some, until the extension with the problem is found. Resolving extension issues with bisect
We can also disable extensions individually and by workspace.
Startup Performance
We can also check the startup timers if VSC seems to start slowly. Press F1 and then select the «Startup Performance» option. Doing so will open an editor with complete performance information.
In the extensions section we visualize the extensions between external and VSC’s own extensions that are loaded at startup.
Show Running Extensions
You can see the exact start times of each of your extensions in VSC thanks to this great feature. Press F1 and then select the option «Show running extensions».
The first thing you can see in this tab is the startup activation time. It tells you how long each extension took to activate. From here you can also create a CPU profile and share it with the extension author.
Process Explorer
We can access this diagnostic tool by pressing F1 and then select the option «Open Process Explorer».
A problem with an extension is often the source of high CPU usage. The Extension Host process runs extensions while VSC runs several other processes. We can visualize the memory and CPU usage and determine a plan of action with that extension.
Report Issue
In addition to the above, we can report a performance problem, for that we must access the Help menu and the «Report Issue» option, indicate that it is a performance issue, select the source and complete with details of the behavior we are experiencing.
I hope you found this information useful if you are creating a VSC extension to find and solve performance problems.
Más información / More Information


Deja un comentario